Random Measurement Errors
To describe random errors, we briefly stop considering the length of the folding rule as a source of error; we keep it constant. Instead, we consider the accuracy with which the folding rule is placed and read. This parameter changes with every measurement, independently of the previous measurements.
If you measure the length of the same table 10 times with an ideal folding rule that is exactly l = 2 m long, you will probably get 10 different results, because sometimes the folding rule slips a little to the left and sometimes a little to the right. The true length of the table is l = 73.05 cm. The 10 results will be randomly distributed around this value. The following measured values could result from the experiment:
| Measurement | Measured value in cm |
|---|---|
| 1 | 73.13 |
| 2 | 73.04 |
| 3 | 72.98 |
| 4 | 73.08 |
| 5 | 73.05 |
| 6 | 72.95 |
| 7 | 73.11 |
| 8 | 73.10 |
| 9 | 73.00 |
| 10 | 73.08 |
| Mean | 73.05 |
The measured values are plotted on the y-axis. On the x-axis you see the individual measurements from 1 to 10.
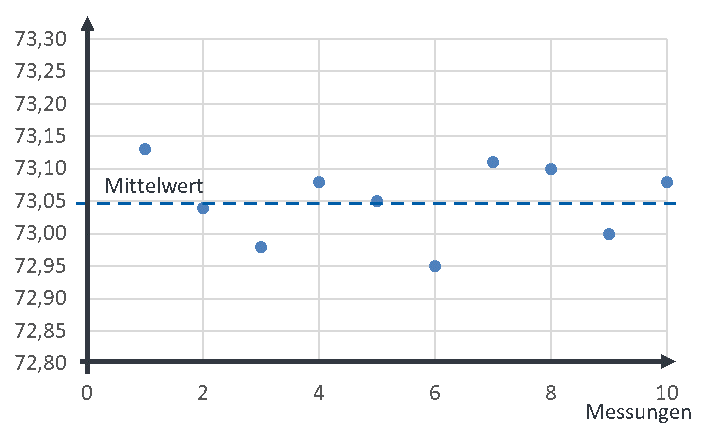
The true value is drawn as a dashed line. If sufficiently many measurements are carried out, the mean of all measurements approaches the true value – provided there are no systematic deviations. So we can compensate for random deviations by forming the mean. If many measured values are recorded one after the other in a measurement system, they always differ from each other. If, for example, 100 consecutive measured values are always averaged, the associated source code in the microcontroller looks like this:
Summe_100_letzte_Werte = Wert1 + Wert2 + Wert3 + (…) + Wert100
Mittelwert = 0.01 ∙ Summe_100_letzte_Werte
A moving average is often used. Here, the oldest value is always removed from the sum and a new, just determined value is added. This then looks like this:
Summe_100_letzte_Werte = Summe_100_letzte_Werte – ältester_Wert + neuester_Wert
Mittelwert = 0.01 ∙ Summe_100_letzte_Werte
(Summe_100_letzte_Werte = sum of the last 100 values, ältester_Wert = oldest value, neuester_Wert = newest value, Mittelwert = mean.)
The more measured values are averaged, the better the mean reduces the influence of chance. A residual of randomness always remains in a measurement.