Filters Part 1
In this tutorial, I call sinusoidal voltage waveforms “signals”. They are characterised by peak value, frequency and phase. Sinusoidal measured values often carry the intensity of the physical quantity in their peak value (amplitude). In measurement technology, the peak value is of more interest than the phase, because the phase only represents a time shift. With measured values, it is rarely important to know exactly at what point in time a value was present. It is often more important to know how large the measured value was.
Let us look at tones and music to illustrate alternating quantities. Tones are sinusoidal quantities. In a smartphone they are generated by sinusoidal voltages. The voltage causes a loudspeaker in the headphones to produce sinusoidal sound. The pitch is determined by the frequency of the signal. The volume of the tone corresponds to its peak value.
A filter changes the peak value (and the phase) of an input signal depending on the signal frequency. At the output, the peak value is larger, unchanged or smaller than at the input. Let us run music through a filter that reduces the peak values of high-frequency signals. The music at the output of the filter sounds muffled, because all high tones (with high frequency) have become quieter.
If the same music passes through a filter that reduces the peak values of low frequencies, it sounds as if it came from a cheap speaker. The bass has become quieter at the output of the filter. Bass tones have low frequencies.
Different frequencies in measurement technology
It is difficult to obtain electrical quantities from physical quantities. The electrical quantities at the output of sensors are often very weak. If they are AC signals, their peak value is very small. We call the sensor signal the useful signal.
Unfortunately, there are many interference signals that enter the measurement system from outside. Interference signals are generally added to the sensor signal. In practice, a useful signal is always superimposed by some interference signal. The goal is to bring the useful signal to the ADC input with the highest possible peak value. The peak values of the interference signals should be as low as possible. Above all, they should be much smaller than the peak value of the useful signal.
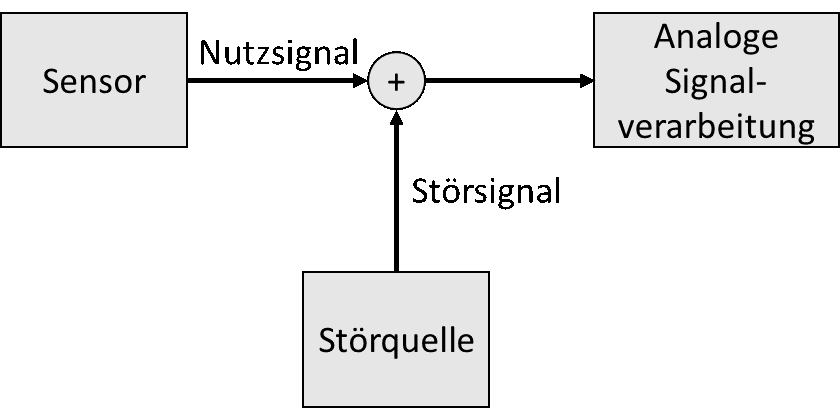
If a signal is attenuated, its peak value becomes smaller. If it is amplified, its peak value becomes larger. Filters are used to attenuate interfering signals.
Filters attenuate or amplify signals to different degrees depending on the signal frequency. If the frequencies of the useful signal and the interference signals are known, filters can be designed so that the interference signals are attenuated and the useful signal is even amplified.
(A note on German grammar: a filter for signals is “das Filter”, a coffee filter is “der Filter”.) As with a coffee filter, some signals are let through and others are held back.
Example
The following figure shows the superposition of a low-frequency useful signal (blue) and a high-frequency interference signal (red). The useful signal is the signal of the human heartbeat, whose frequency lies in the range f = [1 Hz … 3 Hz]. This corresponds to 60 to 180 beats per minute. At the output of the sensor, the heartbeat signal has a peak value of only a few millivolts. We are glad that there is any useful signal at all.
The heart signal (pulse) is superimposed by mains hum. Mains hum is interference from the power socket that acts as an AC voltage with f = 50 Hz and a small peak value. It occurs in all measurement systems that are operated from a power socket.
In the figure below, the heartbeat (blue) as the useful signal and the mains hum (red) as the interference signal are shown as separate signals over time. The heart signal has been approximated as a sine with f = 2 Hz.
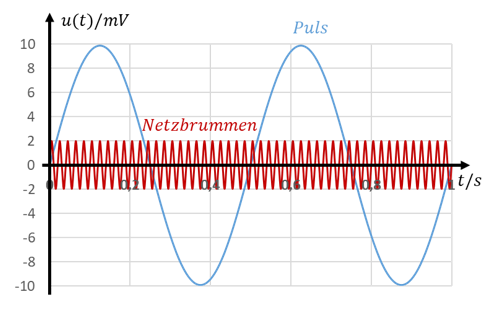
(Puls = pulse, Netz = mains.) If both signals are added, the result is the green signal in the following figure. This signal does contain the heartbeat, but it is unsuitable, e.g. for display at the doctor’s or in hospital.
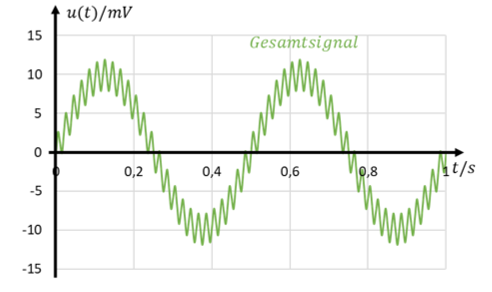
The task of a filter circuit is to reconstruct the blue useful signal from the green total signal. To do this, the useful signal is left unchanged and the peak value of the interference signal is reduced.
Let us anticipate the result: we have somehow built a filter circuit that attenuates the interference signal at f = 50 Hz by a factor of 10. The peak value of the interference signal at the output of the filter is then only 0.2 mV. The circuit lets the useful signal at f = 2 Hz pass unchanged. At the output of this filter, the waveform again looks similar to the blue curve in the first figure. The filtered signal is shown in the figure below:

The better the peak value of the interference signal is reduced, the better the waveform of the useful signal can be reconstructed from the total signal. In the last waveform we can again recognise the heartbeat sufficiently well.
Goal of filtering signals
When a useful signal is superimposed by an interference signal, in measurement technology we want to digitise the useful signal but not the interference signal. To do this, we want to amplify the useful signal as well as possible and reduce the interference signal as much as possible. All the circuits you have learned about so far treat all signals coming from a common source in the same way. So they are not suitable for solving this problem.
If the frequencies of the useful signal and the interference signal differ, we can use filters. These increase or reduce the peak value of AC signals depending on their signal frequency.
The following chapters deal with how filter circuits work in an intuitive way and how they can be implemented.