Signal Flow Diagram and Block Diagram
A signal flow diagram consists of function blocks connected to each other by arrows. Each function block represents a distinct part of the system, such as the sensor or a piece of software. A function block has inputs and outputs. In the simplest case, it has one input and one output. Signals such as the temperature or a digitised number are drawn as arrows between the blocks. If an arrow points towards the block, it is an input quantity.
In the measurement chain, the “physical quantity” is an input signal that the function block “sensor” converts into the output quantity “electrical quantity”. There are various sensors that process different physical quantities, but they all share this basic structure. The function block “analogue signal processing” receives the electrical quantity from the sensor as its input signal and converts it into an electrical voltage for the analogue-to-digital converter. In this way, the transmission of signals through function blocks in the measurement chain can be abstracted independently of the specific technical implementation.
Transfer function
The transfer function H of a function block describes its behaviour mathematically. The following applies
A function block takes the input signal, changes it and outputs it in this changed form at the output. If, for example, a function block doubles the input value, we describe its behaviour mathematically as follows:
With the information H = 2, we have described the function block completely mathematically.
The goal in analysing components is to determine the transfer function H of the function blocks. You can achieve this, for example, by measuring the function blocks. If you apply different input signals and measure the output signals, you can characterise the function block.
As an example, let us take a sensor that measures a substance concentration C in a liquid.
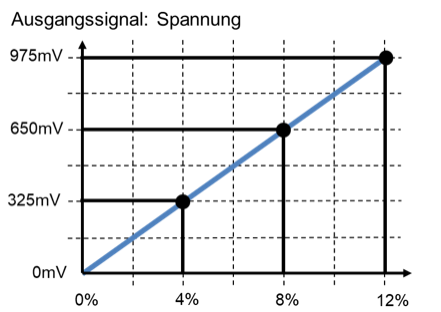
The output signal of the sensor is a voltage. The transfer function can be read off the characteristic curve of the sensor. In the characteristic curve, the output quantity of a function block is plotted on the y-axis against the input quantity on the x-axis. The slope corresponds to the transfer function H.
If you substitute the input quantity into the equation, you obtain the output quantity. So in the example, if you substitute a concentration into the equation, you obtain a voltage:
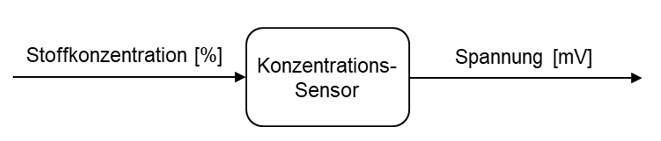
The unit of the transfer function is the unit of the output quantity divided by the unit of the input quantity. To describe the function block completely, we define the concentration sensor in the block diagram as follows:
Purpose of the transfer function
What is the point of specifying a transfer function? It allows the behaviour of an overall system to be determined easily from the behaviour of the function blocks it contains. As an example, let us take a system consisting of three function blocks. The function blocks are connected one after the other.
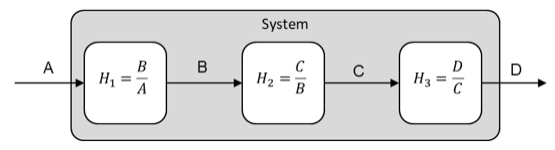
The input of the overall system is the signal A; the signal D is present at the output. The behaviour of the three function blocks is described by their transfer functions H1 to H3. Then the following applies
When analysing the behaviour of the overall system, we no longer have to deal with the signals inside the system; we can simply describe the behaviour of the system via the transfer functions of the function blocks. To do this, we combine the transfer functions of the function blocks into an overall transfer function by simply multiplying them.
When you later assemble a measurement system from function blocks, you can select the function blocks on the basis of their transfer functions so that you obtain the desired overall behaviour between input signal A (physical quantity) and output signal D (output of the measured value).
Please keep this application of the transfer function in mind. In this tutorial, you will determine transfer functions for all circuits that describe the change of a signal between input and output. The transfer function describes mathematically what a function block does with an input signal, i.e. how it changes it. Examples are
- amplifying
- attenuating
- shifting
- filtering
We will go into the meaning of these terms in detail later. Here is another example of a measurement system with the concentration sensor described above:
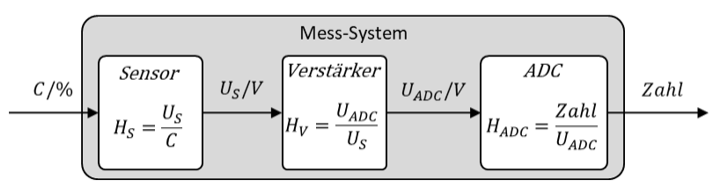
It does not matter how the function blocks work internally. As long as you know their transfer functions, you can calculate the output quantity for a physical quantity that passes through several function blocks one after the other. You take the transfer functions of function blocks either from the data sheets of bought-in parts or you calculate them if you have developed the function blocks yourself.
What is the overall transfer function good for? When the physical quantity at the input of a measurement system changes, the system constantly outputs new numbers at the output. With the transfer function, you can calculate the associated physical quantity at the input, which is what you want to determine.
Summary
The transfer function H describes a function block mathematically, e.g. a sensor. We determine H by applying input quantities to the function block and measuring the associated output quantities. If we plot the output quantity against the input quantity, we obtain the characteristic curve of the function block. The transfer function is the slope of the characteristic curve.